import numpy as np
import matplotlib.pyplot as plt

a, b, N = 0., 1., 25
t = np.arange(a, b, (b-a)/N)

# sarkana svītrlīnija 'r--'
# zili kvadrātiņi     'bs'
# zaļi trijstūrīši    'g^'
plt.plot(t, t, 'r--',
        t, t**2, 'bs',
        t, t**3, 'g^')
plt.savefig('scatter_plain.png')
plt.show()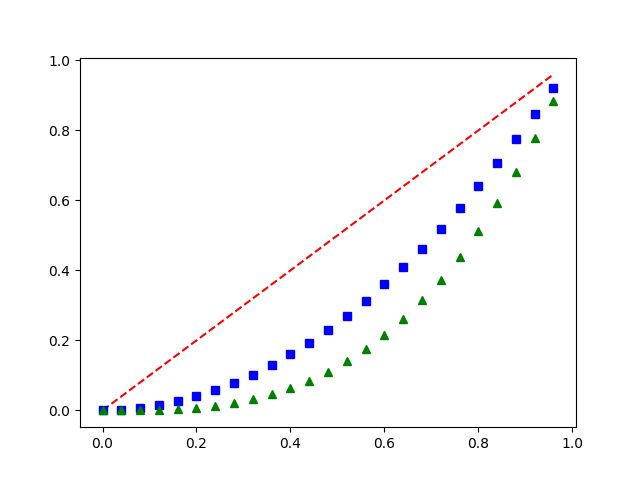
import numpy as np
import matplotlib.pyplot as plt
N = 60
g1 = (0.6 + 0.6 * np.random.rand(N),
        np.random.rand(N))
g2 = (0.4+0.3 * np.random.rand(N),
        0.5*np.random.rand(N))
g3 = (0.3*np.random.rand(N),
        0.3*np.random.rand(N))
data = (g1, g2, g3)
colors = ("red", "green", "blue")
groups = ("coffee", "tea", "water")
fig = plt.figure()
ax = fig.add_subplot(1, 1, 1)
for data, color, group in zip(data, colors, groups):
    x, y = data
    ax.scatter(x, y, alpha=0.8, c=color,
            edgecolors='none', s=30, label=group)
plt.title('Matplot scatter plot')
plt.legend(loc=2)
plt.savefig('scatter_multicolor.png')
plt.show()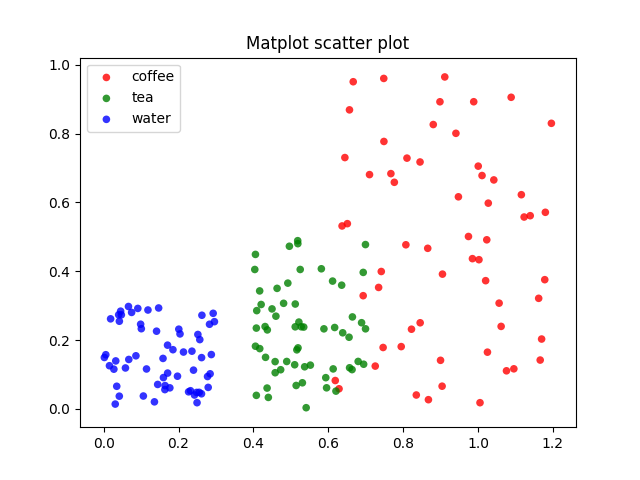
import numpy as np
import matplotlib.pyplot as plt

def f(t):
   return np.exp(-t) * np.cos(2*np.pi*t)

t1 = np.arange(0.0, 5.0, 0.1)
t2 = np.arange(0.0, 5.0, 0.02)

plt.figure(1)
plt.subplot(211)
plt.plot(t1, f(t1), 'bo', t2, f(t2), 'k')

plt.subplot(212)
plt.plot(t2, np.cos(2*np.pi*t2), 'r--')

plt.savefig('scatter_function_graphs.png')
plt.show()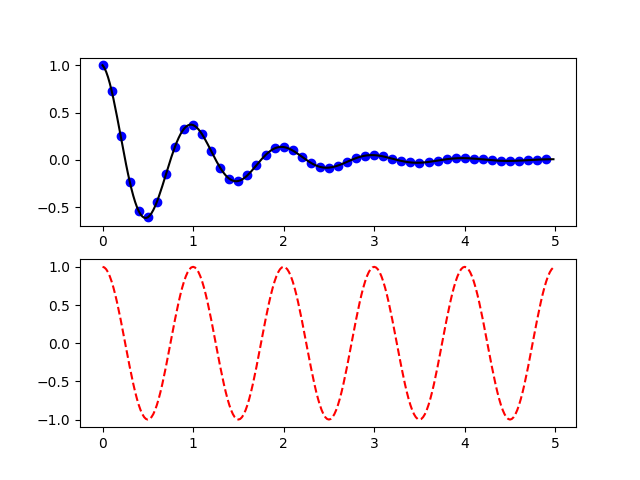
import matplotlib.pyplot as plt
plt.style.use('seaborn-whitegrid')
import numpy as np

x = np.linspace(0, 10, 50)
dy = 0.8
y = np.sin(x) + dy * np.random.randn(50)

plt.errorbar(x, y, yerr=dy, fmt='.k')

plt.savefig('scatter_dots_errors.png')
plt.show()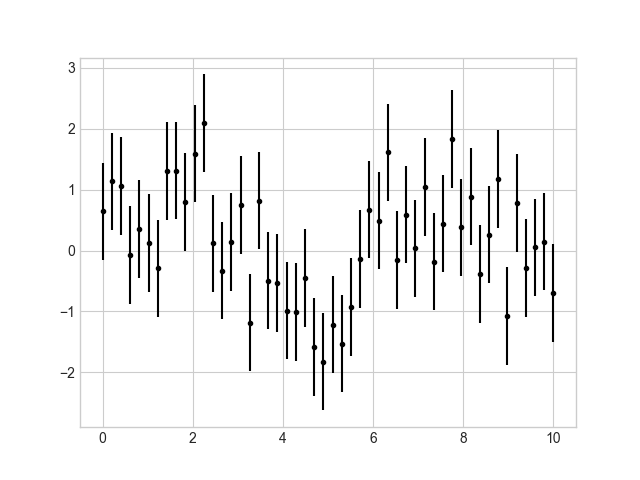
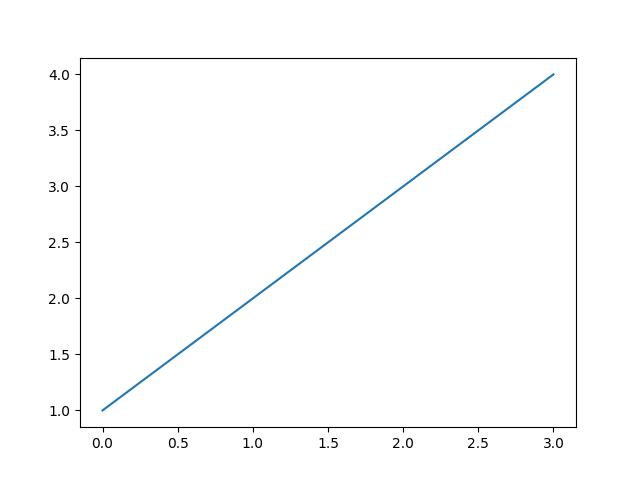
from pylab import *
y = arange(0,3,0.1)
x = 2*y
hlines(y, 0, x, color='b', lw=4)
savefig('bars_hlines.png')
show()
Pārrakstīts ar pilniem “vārdapgabaliem” (namespaces):
import numpy as np
import matplotlib.pyplot as plt

y = np.arange(0,3,0.1)
x = 2*y
plt.hlines(y, 0, x, color='b', lw=4)
plt.savefig('bars_hlines.png')
plt.show()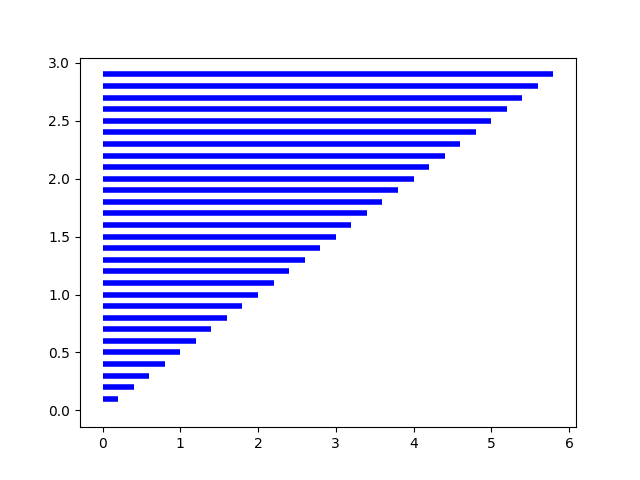
import matplotlib.pyplot as plt
import numpy as np

x = np.random.normal(2, 0.5, 100000)
plt.hist(x, bins=50)
plt.savefig('bars_histogram_plain.png')

plt.show()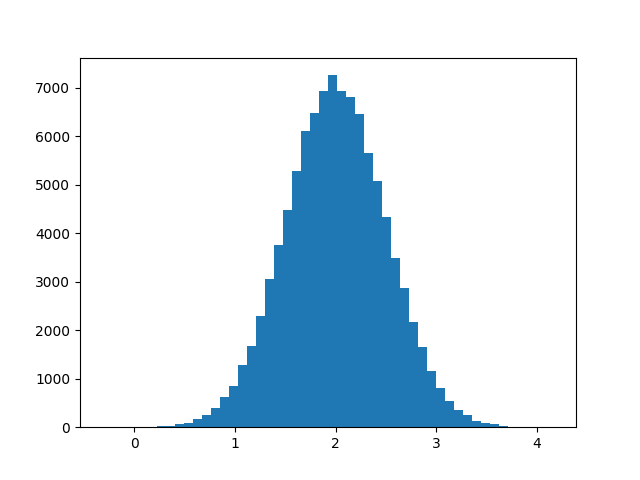
# -*- coding: utf-8 -*-
import numpy as np
import matplotlib.pyplot as plt

N = 10000
mu, sigma = 175, 7
x = mu + sigma * np.random.randn(N)

plt.hist(x, 50, density=True,
        facecolor='g', alpha=0.75, ec='#000088')
plt.xlabel('Garums (cm)')
plt.ylabel('Varbūtība')
plt.title('%d cilvēku garums; μ=%d, σ=%d' %
        (N,mu,sigma))
plt.text(60, .025, r'$\mu=%d,\ \sigma=%d$' %
        (mu,sigma))
plt.axis([140, 210, 0, 0.07])
plt.grid(True)

plt.savefig('bars_histogram_separated.png')
plt.show()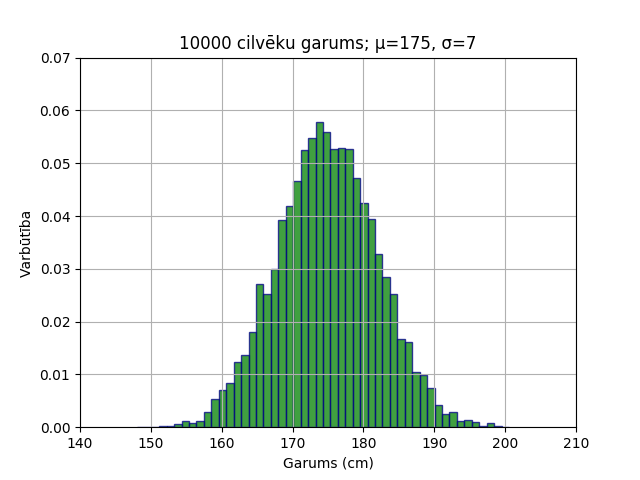
import numpy as np
#from pylab import *
import matplotlib.pyplot as plt

labels = ["Baseline", "System"]
data =   [3.75,       4.75]
error =  [0.3497,     0.3108]

xlocations = np.array(range(len(data)))+0.5
width = 0.5
plt.bar(xlocations, data, yerr=error,
        width=width)
plt.yticks(range(0, 8))
plt.xticks(xlocations + width/2, labels)
plt.xlim(0, xlocations[-1]+width*2)
plt.title("Average Ratings")

plt.savefig('bars_with_errors.png')
plt.show()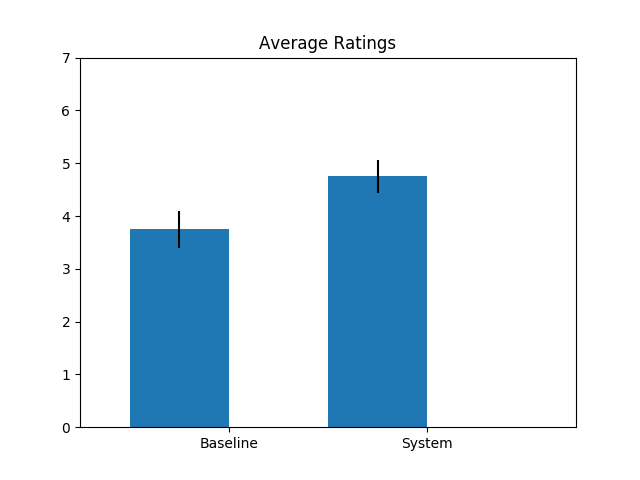
import matplotlib as mpl
from mpl_toolkits.mplot3d import Axes3D
import numpy as np
import matplotlib.pyplot as plt
import matplotlib.image as mpimg

mpl.rcParams['legend.fontsize'] = 10
fig = plt.figure()
ax = fig.gca(projection='3d')
theta = np.linspace(-4*np.pi,4*np.pi,200)
z = np.linspace(-2, 2, 200)
r = z**2 + 1
x = r * np.sin(2*theta)
y = r * np.cos(2*theta)
ax.plot(x, y, z, label='parametric curve')
ax.legend()

plt.savefig('3d_parametric_curve.png')
plt.show()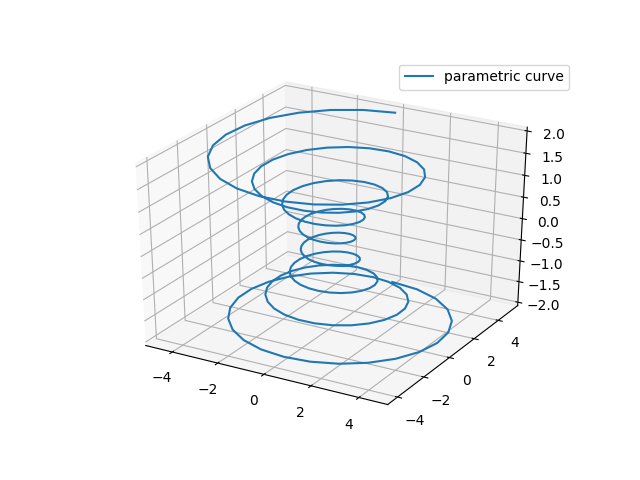
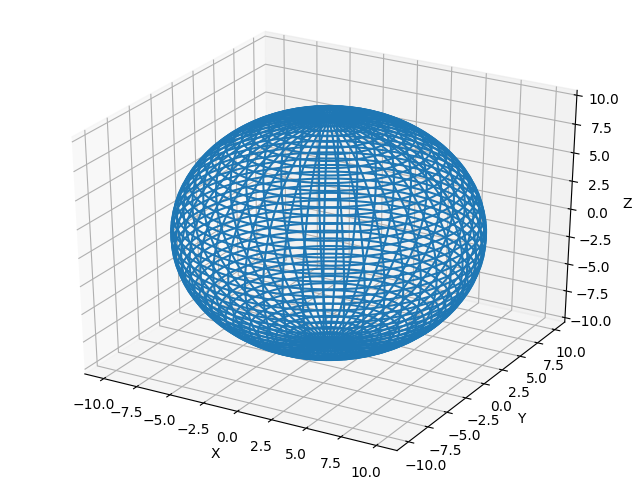
from numpy import *
import pylab as p
import mpl_toolkits.mplot3d.axes3d as p3

u=r_[0:2*pi:100j]
v=r_[0:pi:100j]
x=10*outer(cos(u),sin(v))
y=10*outer(sin(u),sin(v))
z=10*outer(ones(size(u)),cos(v))

fig=p.figure()
ax = p3.Axes3D(fig)
ax.plot_wireframe(x,y,z)
ax.set_xlabel('X')
ax.set_ylabel('Y')
ax.set_zlabel('Z')
p.savefig('3d_sphere.png')
p.show()